Decoding the Dynamics: Understanding Foreign Exchange Market Trends Through Graphical Analysis
Unlock insights into foreign exchange market trends using graphical analysis. Explore this guide decoding market dynamics, providing visual insights into trends, patterns, and shifts shaping the global forex landscape

The foreign exchange market is a dynamic and complex financial market that plays a crucial role in global trade and investment. As an investor or trader in this market, it is essential to understand the trends and patterns that drive the movement of currency pairs. In this article, we will explore the importance of understanding market trends, the role of graphical analysis in foreign exchange market trends, different types of graphical analysis tools used in forex trading, how to interpret foreign exchange market graphs, common patterns and trends in foreign exchange market graphs, strategies for trading based on graphical analysis, tips for using graphical analysis effectively in forex trading, and finally, we will analyze case studies to understand foreign exchange market trends through graphical analysis. By the end of this article, you will have a comprehensive understanding of the power of graphical analysis in foreign exchange trading.
Introduction to the Foreign Exchange Market
The foreign exchange market, also known as the forex market, is a decentralized marketplace where currencies are traded. It is the largest and most liquid financial market in the world, with an average daily trading volume of over $6 trillion. The main participants in this market are commercial banks, central banks, hedge funds, multinational corporations, and individual traders.
Importance of Understanding Market Trends
Understanding market trends is crucial in foreign exchange trading as it helps traders make informed decisions about when to buy or sell currencies. By analyzing market trends, traders can identify potential opportunities for profit and minimize the risk of losses. Market trends can be influenced by various factors such as economic indicators, geopolitical events, and central bank policies.
The Role of Graphical Analysis in Foreign Exchange Market Trends
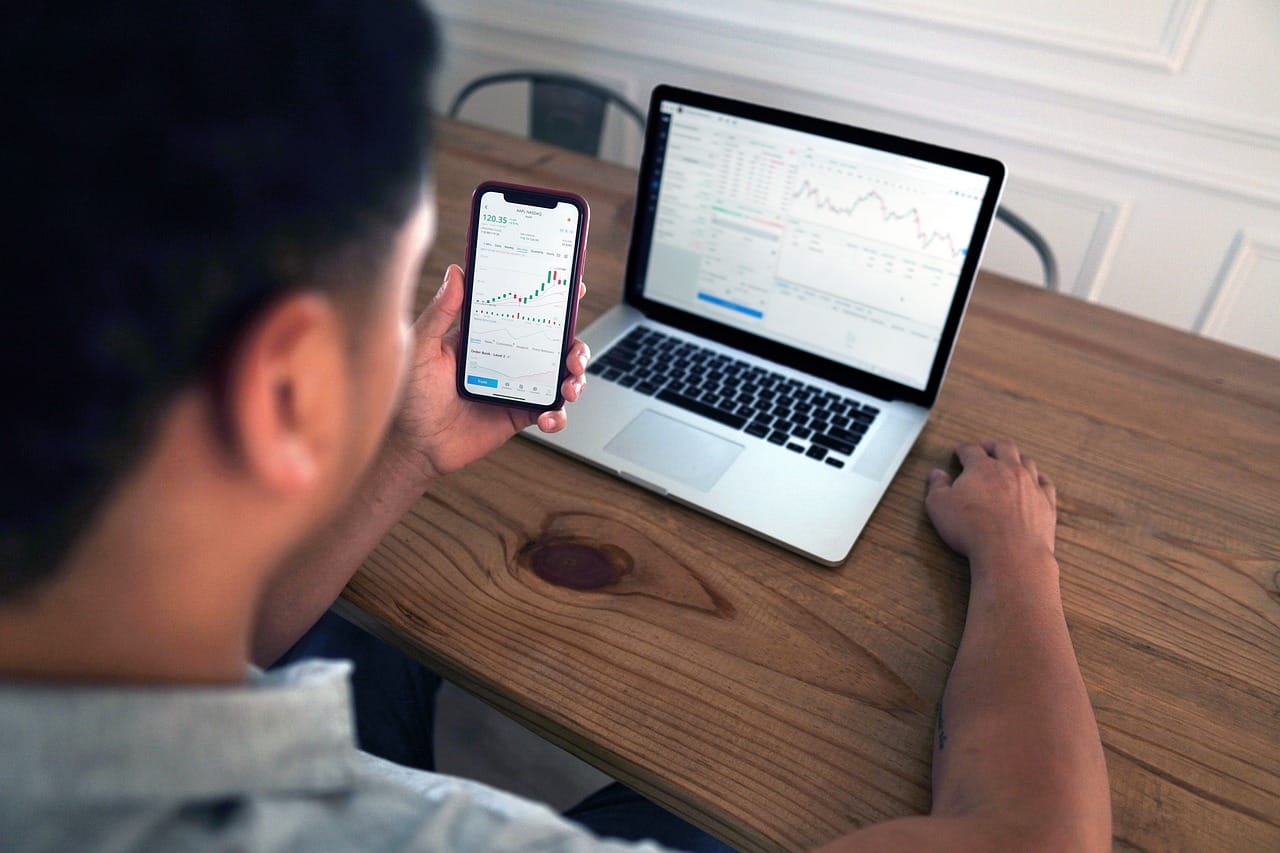
Graphical analysis is a powerful tool used by forex traders to visualize and interpret market trends. It involves the use of charts and graphs to represent historical price data and identify patterns and trends. Graphical analysis helps traders identify support and resistance levels, trend lines, and chart patterns, which can be used to predict future price movements.
Types of Graphical Analysis Tools Used in Forex Trading
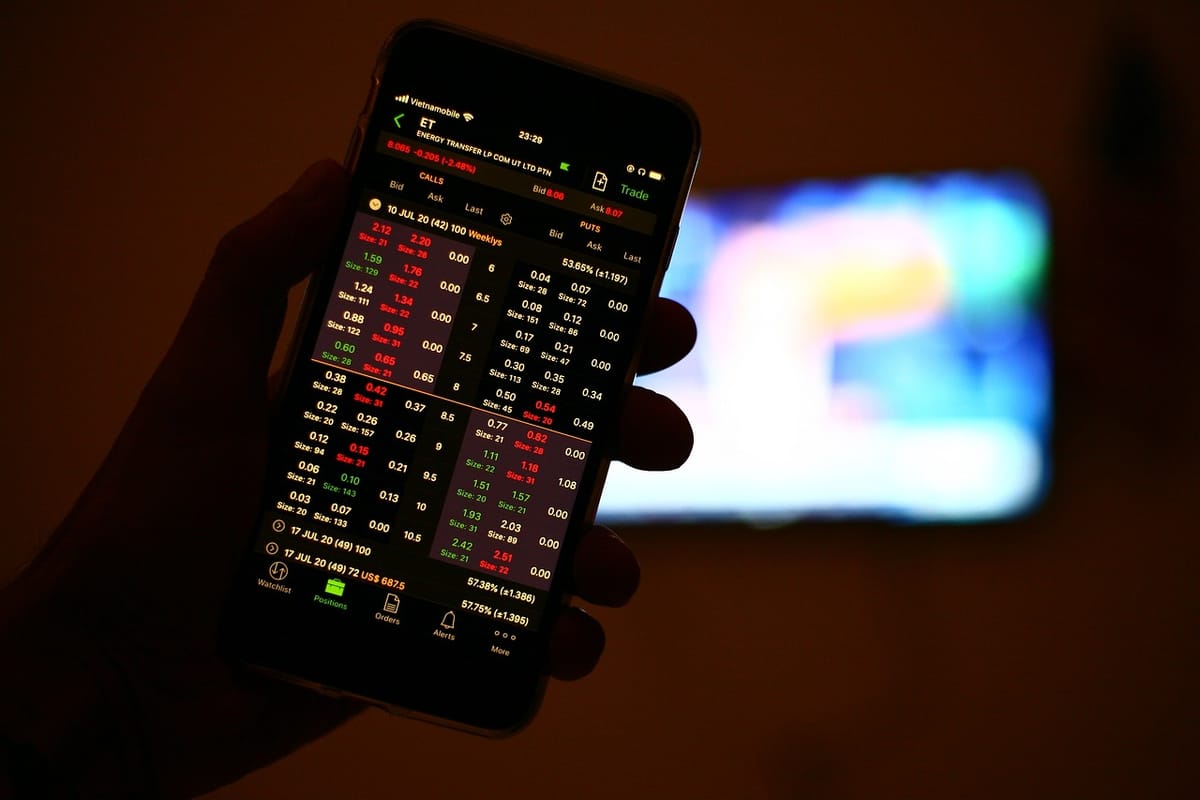
There are several types of graphical analysis tools used in forex trading. The most commonly used tools include line charts, bar charts, and candlestick charts. Line charts provide a simple representation of price data by connecting the closing prices over a specific period of time. Bar charts display the opening, closing, high, and low prices for a given period. Candlestick charts, on the other hand, provide more detailed information by representing price data in the form of candlestick patterns.
How to Interpret Foreign Exchange Market Graphs
Interpreting foreign exchange market graphs requires an understanding of basic chart patterns and technical indicators. Chart patterns such as trend lines, support and resistance levels, and chart formations can provide valuable information about the direction of price movements. Technical indicators such as moving averages, relative strength index (RSI), and stochastic oscillators can be used to confirm or validate the signals provided by chart patterns.
Common Patterns and Trends in Foreign Exchange Market Graphs
Foreign exchange market graphs often exhibit common patterns and trends that can be used to predict future price movements. Some of the common patterns include head and shoulders, double tops and bottoms, triangles, and flags. Trends can be classified as uptrends, downtrends, or sideways trends. By identifying these patterns and trends, traders can make more accurate predictions and improve their trading strategies.
Strategies for Trading Based on Graphical Analysis
There are several trading strategies that can be implemented based on graphical analysis. One popular strategy is trend following, where traders aim to profit from the continuation of an established trend. Another strategy is range trading, which involves buying at support levels and selling at resistance levels. Breakout trading is a strategy where traders aim to capitalize on the price movement that occurs when a currency pair breaks out of a trading range.
Tips for Using Graphical Analysis Effectively in Forex Trading
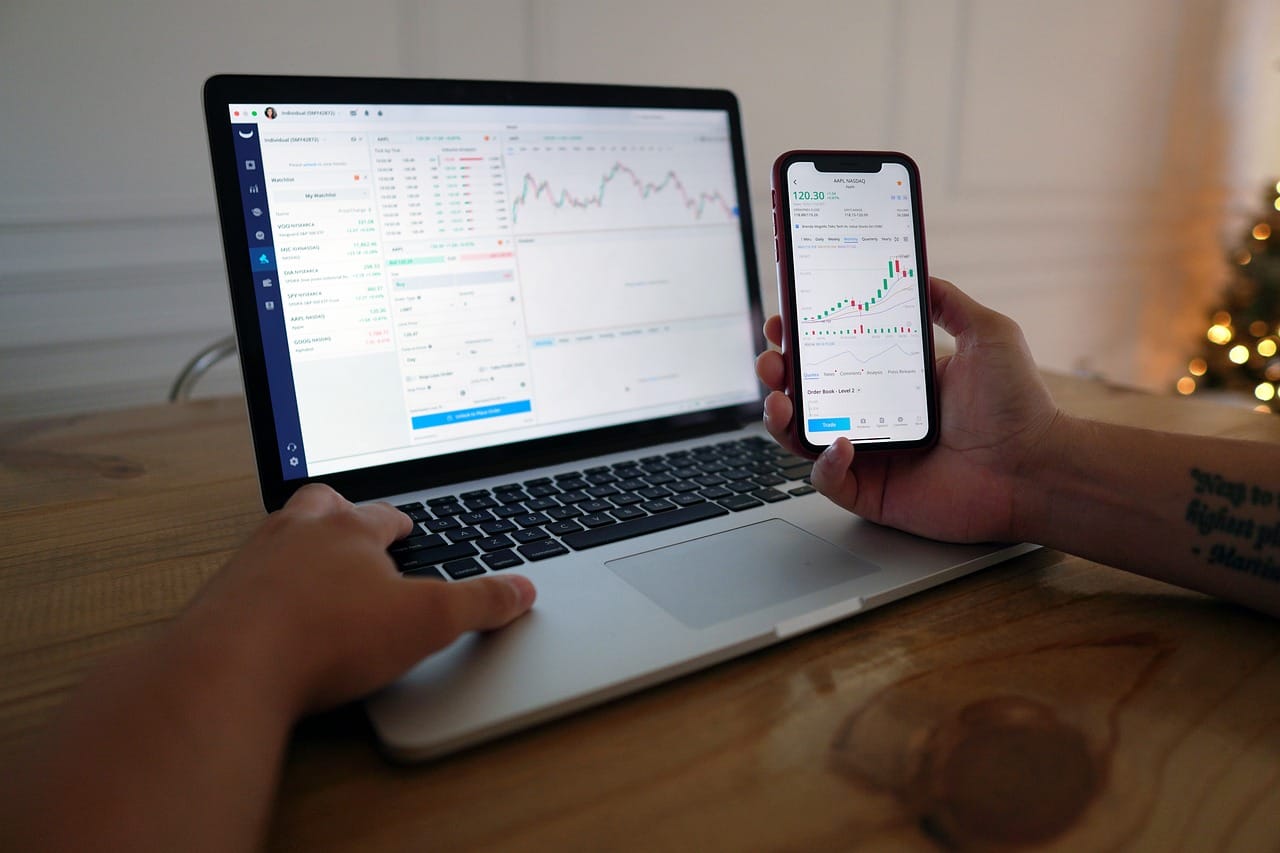
To use graphical analysis effectively in forex trading, it is important to follow some tips and best practices. Firstly, it is crucial to use multiple time frames when analyzing charts to get a broader perspective of the market. Secondly, it is important to focus on the most relevant chart patterns and indicators that align with your trading strategy. Lastly, it is essential to constantly update your knowledge and skills in graphical analysis to stay ahead of market trends.
Case Studies: Analyzing Foreign Exchange Market Trends Through Graphical Analysis
To further understand the power of graphical analysis in foreign exchange trading, let's analyze some case studies. In Case Study 1, we will examine the trend following strategy applied to a currency pair that exhibited a strong uptrend. In Case Study 2, we will explore how range trading can be profitable in a sideways trending market. These case studies will provide practical insights into the application of graphical analysis in real-world trading scenarios.
Conclusion: Harnessing the Power of Graphical Analysis in Foreign Exchange Trading
In conclusion, graphical analysis is a valuable tool for understanding and predicting trends in the foreign exchange market. By mastering the art of interpreting market graphs, traders can make more informed decisions and improve their trading strategies. Whether you are a beginner or an experienced trader, incorporating graphical analysis into your trading routine can significantly enhance your chances of success. So, start harnessing the power of graphical analysis today and unlock the potential of the foreign exchange market.
CTA: Start your journey in foreign exchange trading by mastering graphical analysis. Sign up for our comprehensive course on graphical analysis and take your trading to new heights.